
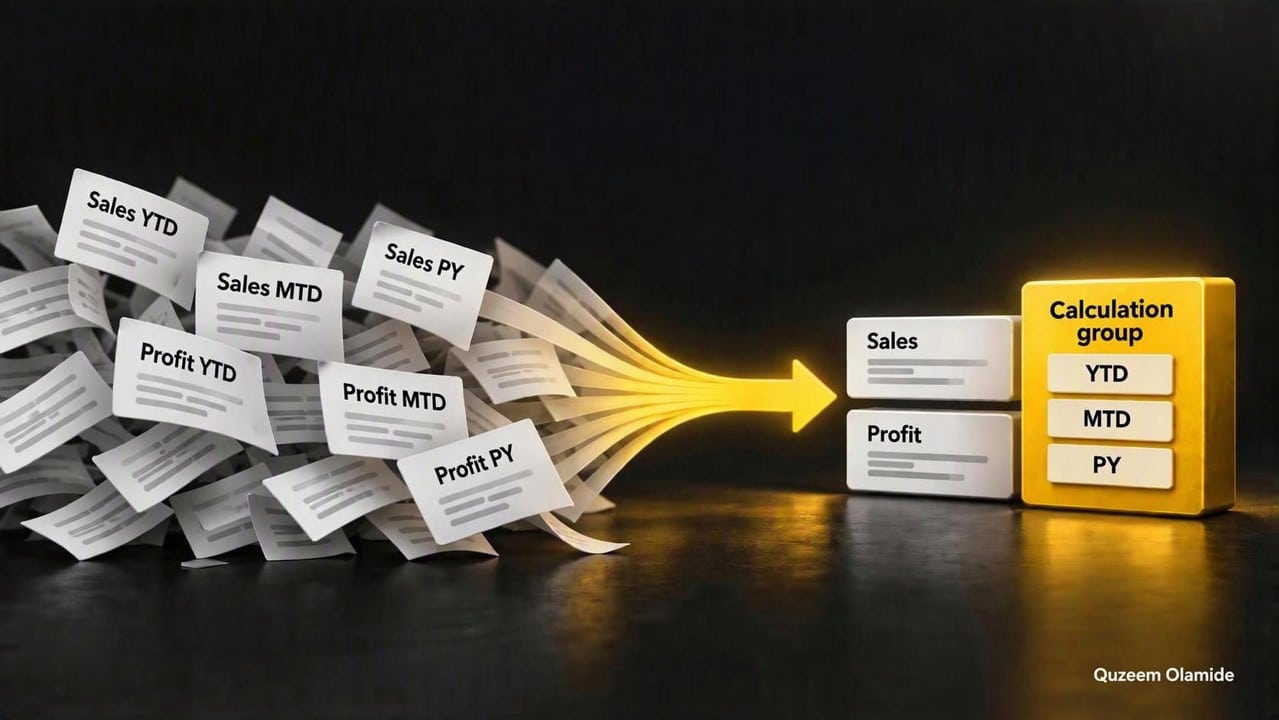
Time intelligence is one of the most common requirements when building enterprise-grade Power BI data models, Almost every reporting solution eventually needs calculations such as Year-to-Date (YTD), Month-to-Date (MTD), Previous Year (PY), year-over-year variance, and year-over-year percentage change. The DAX behind these calculations is usually not the difficult part. The real problem is what happens when those calculations have to be repeated across many measures. You end up having hundreds of near-identical measures cluttering your field list, each following the same pattern but with slightly different logic.
This leads to what’s called measure bloat and it creates several challenges:
- Maintenance nightmare: When your underlying time intelligence logic needs to change, you must update dozens (or hundreds) of individual measures.
- Confusing field list: End users struggle to find the right measure among dozens of similarly named options.
- Inconsistency: It’s easy for different measures to drift from each other over time, creating discrepancies.
- Redundant DAX: You’re essentially copy-pasting the same calculation structure repeatedly.
Calculation Groups solve this by letting you define a single measure and apply time intelligence “modifiers” that dynamically change the calculation context, without creating separate physical measures.
Background: What Are Calculation Groups?
Calculation groups may feel like a relatively new Power BI Desktop feature, but the technology itself is not new. They’ve existed in Analysis Services Tabular models for years.
A Brief Timeline:
| Version | Availability |
|---|---|
| SSAS Tabular 2019 | First introduced via Tabular Editor |
| Azure Analysis Services | Added support |
| Power BI Desktop (Native UI) | Generally Available (May 2024) |
Before Power BI natively supported them, users created Calculation Groups using Tabular Editor, an external tool that connects to your data model. While this worked, it meant stepping outside of Power BI Desktop to make changes, which wasn’t ideal for everyone.
What Is a Calculation Group?
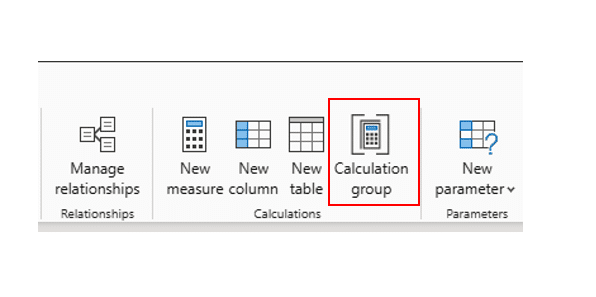
A Calculation Group is a table (typically hidden from client tools) that contains Calculation Items. Each Calculation Item represents a calculation modification, like Year-to-Date or vs Previous Year, that can be applied to any base measure.
When a user selects a Calculation Item from a slicer or filter, it dynamically modifies the DAX context for whatever measure they’re viewing.
How Calculation Groups Actually Work: SELECTEDMEASURE() Explained
At the heart of every Calculation Item is SELECTEDMEASURE(), understanding this function is the key to understanding how Calculation Groups work at a technical level.
SELECTEDMEASURE() is a DAX function that returns the measure currently being evaluated in the filter context. It acts as a placeholder, it doesn’t calculate anything on its own. Instead, it captures whichever measure the user has dragged into a visual, and then the Calculation Item wraps it with additional logic.
When a Calculation Item expression is evaluated, SELECTEDMEASURE() is temporarily replaced with the actual measure reference from the visual. This happens at query time, inside the calculation group’s internal CALCULATE context.
Creating a Time Intelligence Calculation Group in Power BI
Your model should already have:
- A proper Date table
- Relationships configured appropriately
- Explicit measures that you want the calculation group to transform (Calculation Group discourages Implicit Measures)
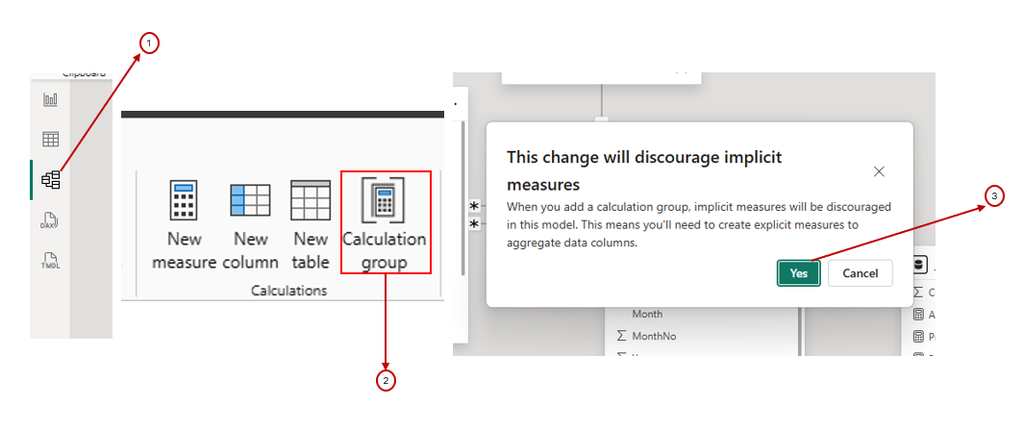
The last point is important. Calculation groups apply to explicit measures, not implicit measures. When a calculation group is added, Power BI requires the model’s Discourage implicit measures property to be enabled.
Step 1: Go to the Modeling Tab
In Power BI Desktop, navigate to the Modeling ribbon and click New calculation group.
Step 2: Name Your Calculation Group
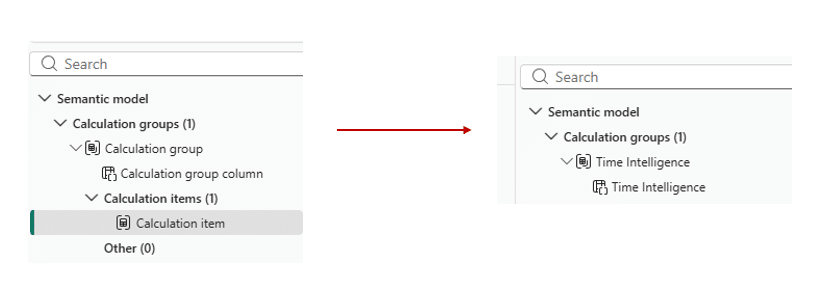
Enter a name for the calculation group. For time intelligence, something like Time Intelligence or Period Comparisons works well.
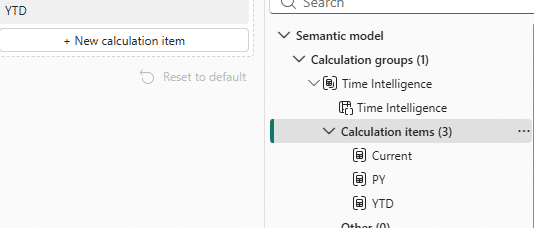
Step 3: Add Calculation Items
Click New calculation item to add items to your group. Common time intelligence items include:
| Item Name | Expression |
|---|---|
| Current | SELECTEDMEASURE() |
| PY | PY = |
| YTD | YTD = CALCULATE(SELECTEDMEASURE(), DATESYTD('Calendar'[Date])) |
Using the Calculation Group in a Report
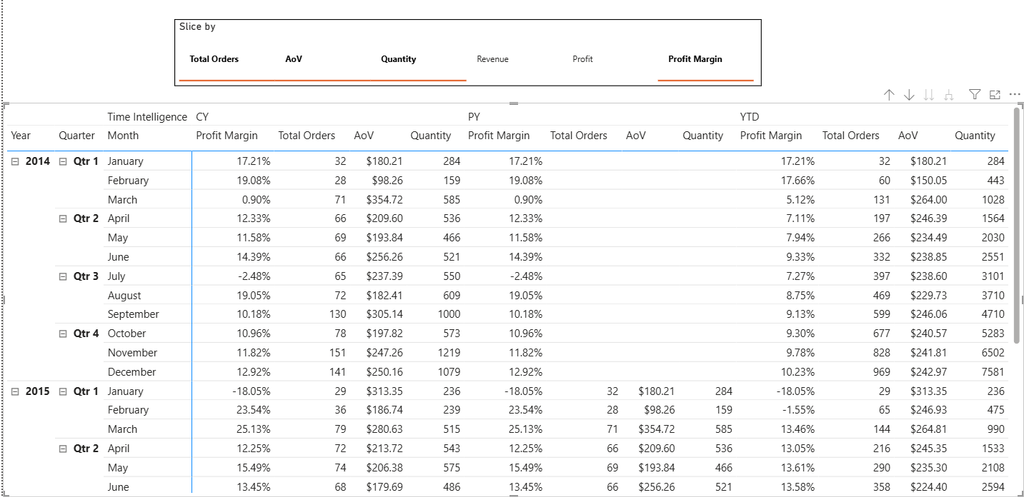
Once the group has been created, its column behaves like a field that can be used in the reporting layer. A common Matrix setup is:
- Date Hierarchy on Rows
- The Time Intelligence calculation-group column on Columns
- An explicit measure in Values or a field parameter of measures such as
Profit,Total Orders,Revenueetc
Ordinal: Controlling the Order of Calculation Items
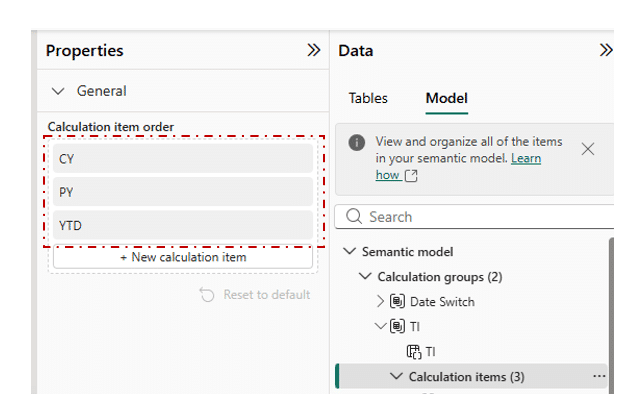
After creating the calculation items, you may want them to appear in a specific logical sequence. This is where Ordinal comes in. Ordinal controls the ordering of calculation items.
| Calculation Item | Ordinal |
| Current | 0 |
| PY | 1 |
| YTD | 2 |
| YoY | 3 |
ordering can be done through the model view tab, by dragging and dropping to rearrange the order of appearance
Dynamic Format Strings
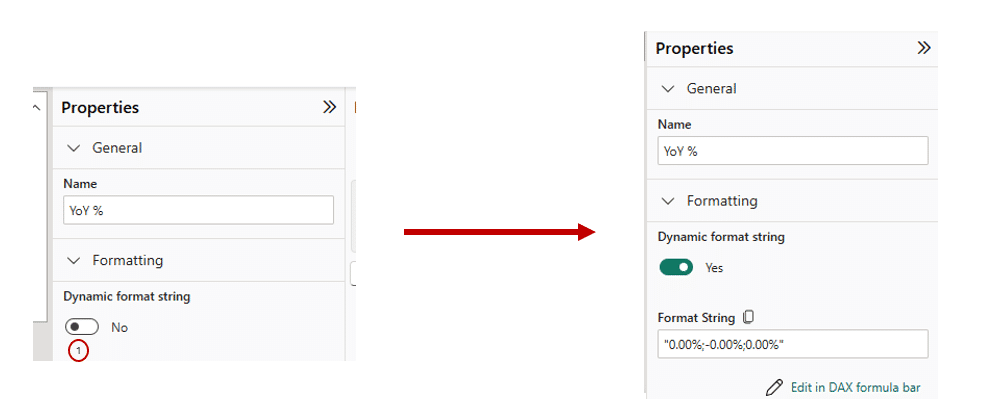
Suppose Revenue is formatted as currency. YTD and Previous Year should normally remain currency values, but YoY % should display as a percentage rather than inheriting the original currency format.
By default, calculation items inherit the formatting of the underlying measure. A calculation item can instead have a Dynamic Format String that changes how the resulting value is displayed.
For other items, you may want to retain the selected measure’s existing format.
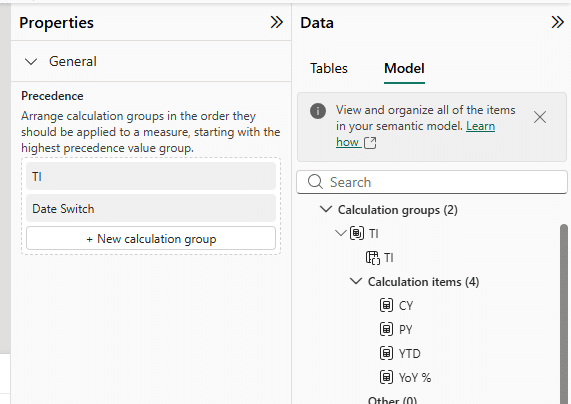
Precedence: When Multiple Calculation Groups Meet
Imagine your model contains Time Intelligence, Currency Conversion, and Metric Transformation calculation groups. A measure may then be affected by more than one calculation group. The order in which those transformations are applied matters, and the Precedence property specifies that order. Precedence determines the order in which Calculation Groups are applied when you have multiple calculation groups in a single report. This is rare but useful in complex scenarios.
Ordinal and Precedence are easy to confuse, but they solve completely different problems.
Ordinal: Controls the ordering of calculation items within a calculation group.
Precedence: Controls how multiple calculation groups interact when more than one is applied.
Calculation Groups solve the measure bloat problem by centralizing common calculation variations into a single, reusable structure. What once required maintaining dozens of near-identical measures can now be accomplished with one base measure and a Calculation Group that dynamically modifies the context.
By leveraging precedence, ordinal, and dynamic format strings, you can build a robust Time Intelligence layer that is easy to maintain, consistent across your model, and intuitive for end users.
Live Build
If you’re interested in seeing how this works in practice, have a watch of the full end-to-end build from the Dynamic Reporting with Field Parameters and Calculation Groups webinar session below.
Watch the full build webinar: Click Here
Thanks for staying till the end!

